All Populations the Same Size:
You may have noticed something about the dozens of explicit assumptions listed on the Main Page of this web site. There is nothing there that specifically requires humans as the subject. For that matter, it does not limit itself to mammals or even carbon based life form. It does not apply to all of known life. Bacteria handle their chromosomes in a completely different way, so the assumptions and thus the logic do not apply to them. But basically all higher forms of animal life, say anything with legs, would fit the assumptions.
This leads to a grossly counter-intuitive hunch.
Notice that the results of the program are not that far off reality. It is hard to translate the “relatedness” of the Iceland study to the “population size” of the computer model, but at a glance the actual numbers do not appear to be very different. They ought to be at least within an order of magnitude, a factor of ten say, of being the right absolute numbers.
I make no claim that they actually are the right absolute numbers. I base my argument of many proofs on the claim that the pattern is about the same. As I said more than once, nature holds us to a far stricter account than the computer program. Within the program the time taken for a pollution to go from takeoff to crash is about 80 generations; history indicates that it takes in fact about ten generations in humans.
Such a close match is remarkable in that the assumed numbers are so far from being realistic. When the program specifies 12 offspring per couple or less, and we chose 6, that is in effect the number of times a woman would ovulate. A healthy woman typically will do that 13 times a year. So our model is off by more than an order of magnitude.
Similarly, when we specify up to 100 gene pairs subject to the different kinds of mutations, that is almost laughable. There are tens of thousands of genes and far more DNA than that which is in classical genes. In fact, it seems that about 90% or more of DNA gets somehow read and transcribed into RNA, in which form it probably has some sort of effect. So the number of potentially significant mutations in any one individual is numbered in the many billions. Our assumed number of mutation sites may be off by 7 orders of magnitude.
Yet our results are off by less than one.
Mutation rates and impacts had to be tweaked to get the kind mutation burden we would expect an optimized life form to endure, so they really don’t count as assumptions in the same sense. They are far from reality only because prior assumptions were far from reality and in the case of impact for the sake of simplicity as well.
So we specifically make wild assumptions and come up with tame results. The conclusion that presses itself on us is that the absolute numbers dictating just how big a population must be to survive inbreeding or to generate a maximal growth rate or maximal stability or just how long a cycle of growth and collapse may be, these things are very insensitive to our starting assumptions.
So the hunch is this:
All species of higher animals have about the same optimum population size, at least within an order of magnitude.
Think about how weird that is. That is to say a Florida panther on lonely patrol over his 90 mile range is a member of a gene pool that is about the same size as that of a buffalo charging across the Western Plains shoulder to shoulder with an immense herd of his fellows.
It is to say that a baleen whale that scoops up many gallons of water to strain out the krill (at least I think krill are among whale foodstuffs – if you differently, please insert the truth), that whale is member of a gene pool with about the same number of members as the populations the krill belong to.
This hunch is subject to being tested, and the data set exists. A study has been published: Population Size Does Not Influence Mitochondrial Genetic Diversity in Animals. Eris Bazin, Sylvain Glémin, Nicolas Galtier SCIENCE VOL: 312 570 28 APRIL 2006. What they did was to look at genetic studies of about 3,000 different kinds of animals. They discovered a distribution of average population sizes the looks like this.
Figure 1.
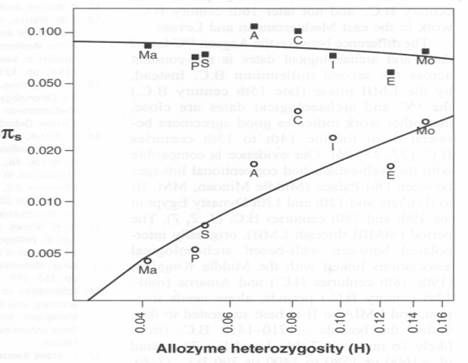
Population Size Does Not Influence Mitochondrial Genetic Diversity in Animals. Eris Bazin, Sylvain Glémin, Nicolas Galtier SCIENCE VOL: 312 570 28 APRIL 2006. Ma is mammals, P is fish, S is reptiles and birds, A is amphibians, C is crustaceans, I is insects, E is echinoderms and Mo is mollusks.
The horizontal axis is a form of enzyme variability that for our purposes only serves to spread the data out. The vertical axis, pi sub s, is a parameter for population size that I am unfamiliar with. The circles indicate values for nuclear DNA diversity while the squares represent mitochondrial DNA diversity. If you concede that mammals and fish are somehow more advanced that echinoderms and mollusks, then clearly they have shown that there a systematic relationship between how advanced an animal species is and how big a genetically effective population it lives in must be. That is their point, and they make it very well.
But we can carry it a little farther with the data they present. Their pi sub s parameter ranges from about 0.05 to about 0.005. Assuming that there is a linear relationship between pi sub s and population size, or that population size increases as the square root of s, then the variation in population size is within an order of magnitude even for such an enormous range of anatomical complexity of the many species they looked at. If population size increases as the square of pi sub s, then it is odd that they did not dramatize their results by simply giving us population sizes.
That is not to say that the average population size in the wild is the optimal population size.
As I said, I would not go to the wall defending points in this web site except for the gist of the Main Page. But it certainly seems provocative. Wild as our hunch was, it is consistent with actual data.
We can pursue the data farther. The upper line, which moves rather little, is mitochondrial diversity and relates the female population sizes. The female population sizes are larger than the overall population sizes and thus greater than male population sizes, which we do not actually have. We draw two things from that: first, males appear to compete for female cooperation in reproduction. Males that lose out do not contribute to the gene pool, so the male gene pool size is smaller. Second, this competition becomes more intense, and the proportion of males denied offspring becomes larger, as one moves from mollusks on the one side to mammals on the other.
That makes a kind of intuitive sense. Imagine two amorous mollusks vying for the chance to sire little mollusks. It might not be a very exciting duel. They are rich in protective power but limited in striking ability. Of course their might well be competition, but it is hard to see how it could be deadly. Since mollusks release their eggs and sperm into the water, the only way males might have to compete would be by jockeying for a favorable location with respect to the females. It might be possible to see this going on by seeing whether the males were randomly distributed among the females or whether they had preferred coigns of vantage. It all events it is not likely to be dangerous for the males.
Contrast that with a couple of hot blooded young European males competing directly or indirectly for a woman in some earlier centuries. Quarrels were often handled by resorting to duels with pistols or swords. With such weapons, the effectiveness of attack is far superior to the effectiveness of defense. The result tends to limit the male gene pool size and, all right I am pushing the argument, reduces the overall gene pool. This is good for the population, since keeping gene pool sizes small is so important.
No, I do not advocate returning to dueling. And it has largely been eliminated for humans, but vigorous competition for females continues among animals.
There have been 73 visitors to the site so far.
Home page.